
Grafana dashboard
After enabling and configuring metrics, you can visualise them using Tarantool Grafana dashboards. These dashboards are available as part of Grafana official & community-built dashboards:
Tarantool 3 | |
|---|---|
Tarantool Cartridge and Tarantool 1.10–-2.x | |
Tarantool Data Grid 2 |
The Tarantool Grafana dashboard is a ready for import template with basic memory, space operations, and HTTP load panels, based on default metrics package functionality.
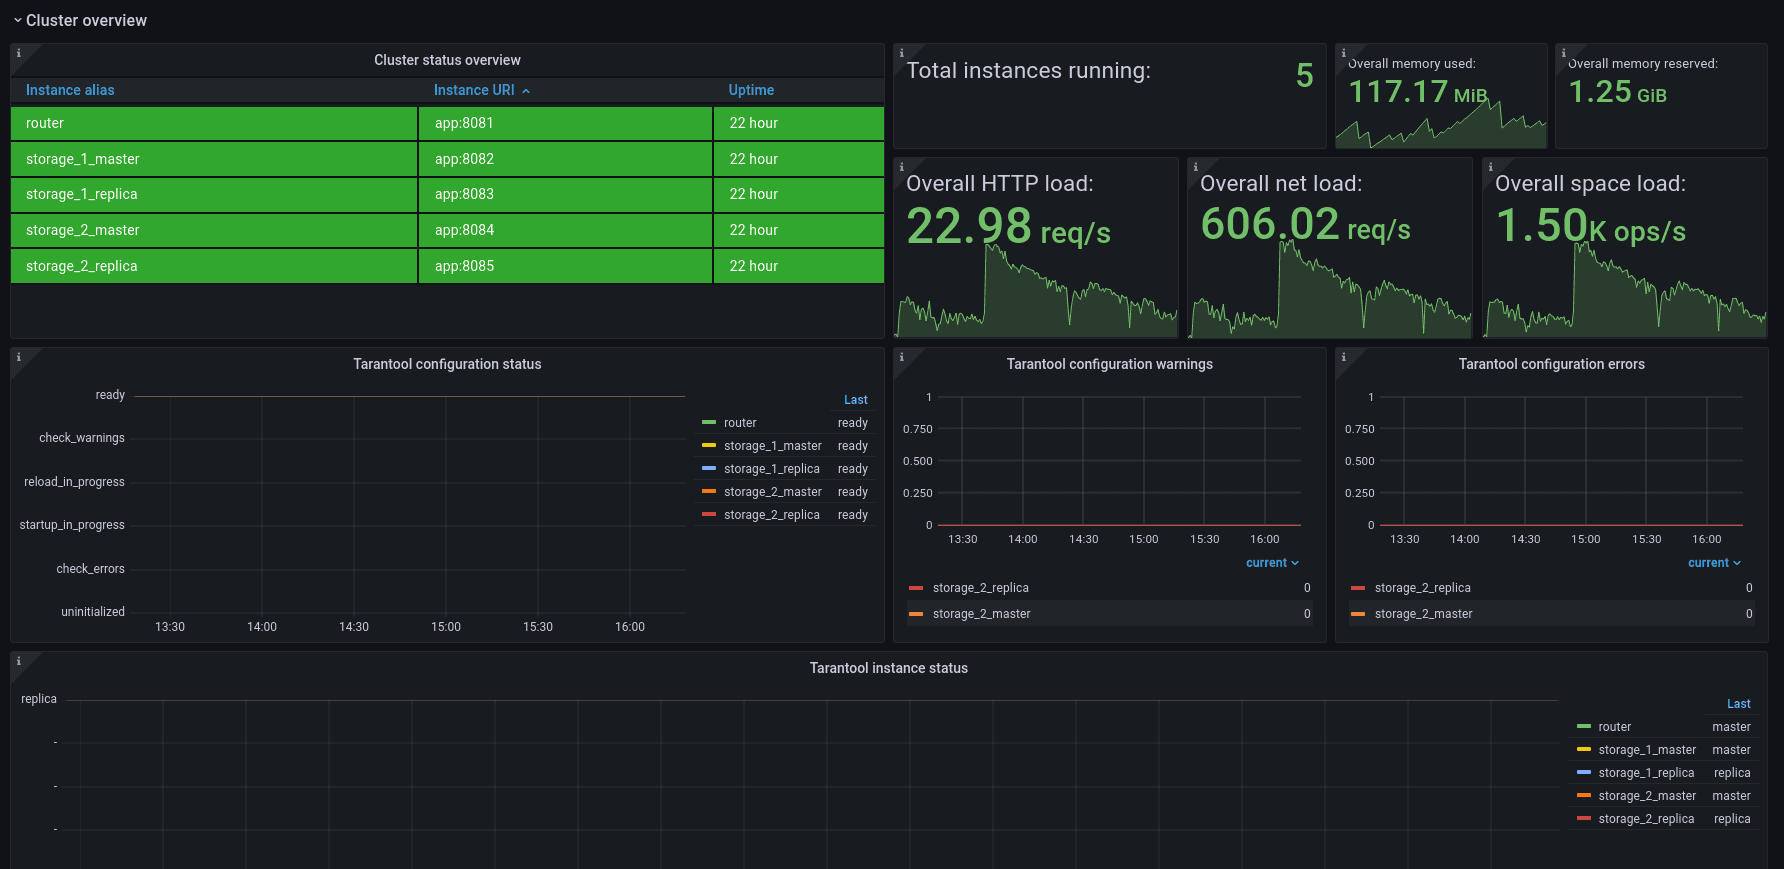
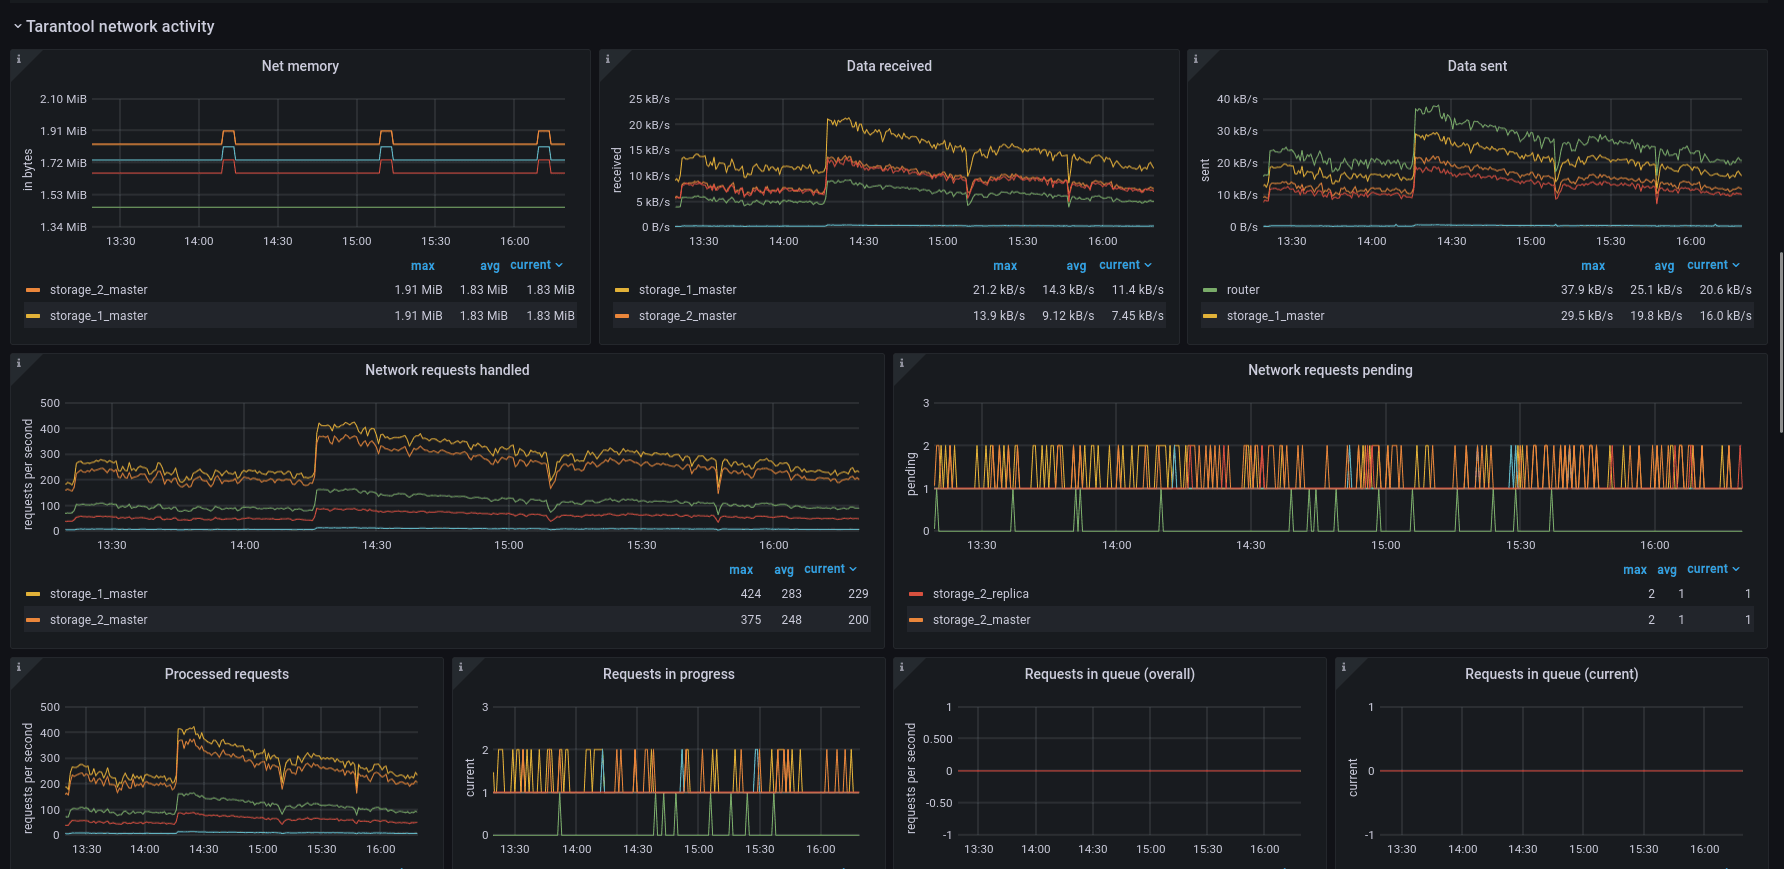
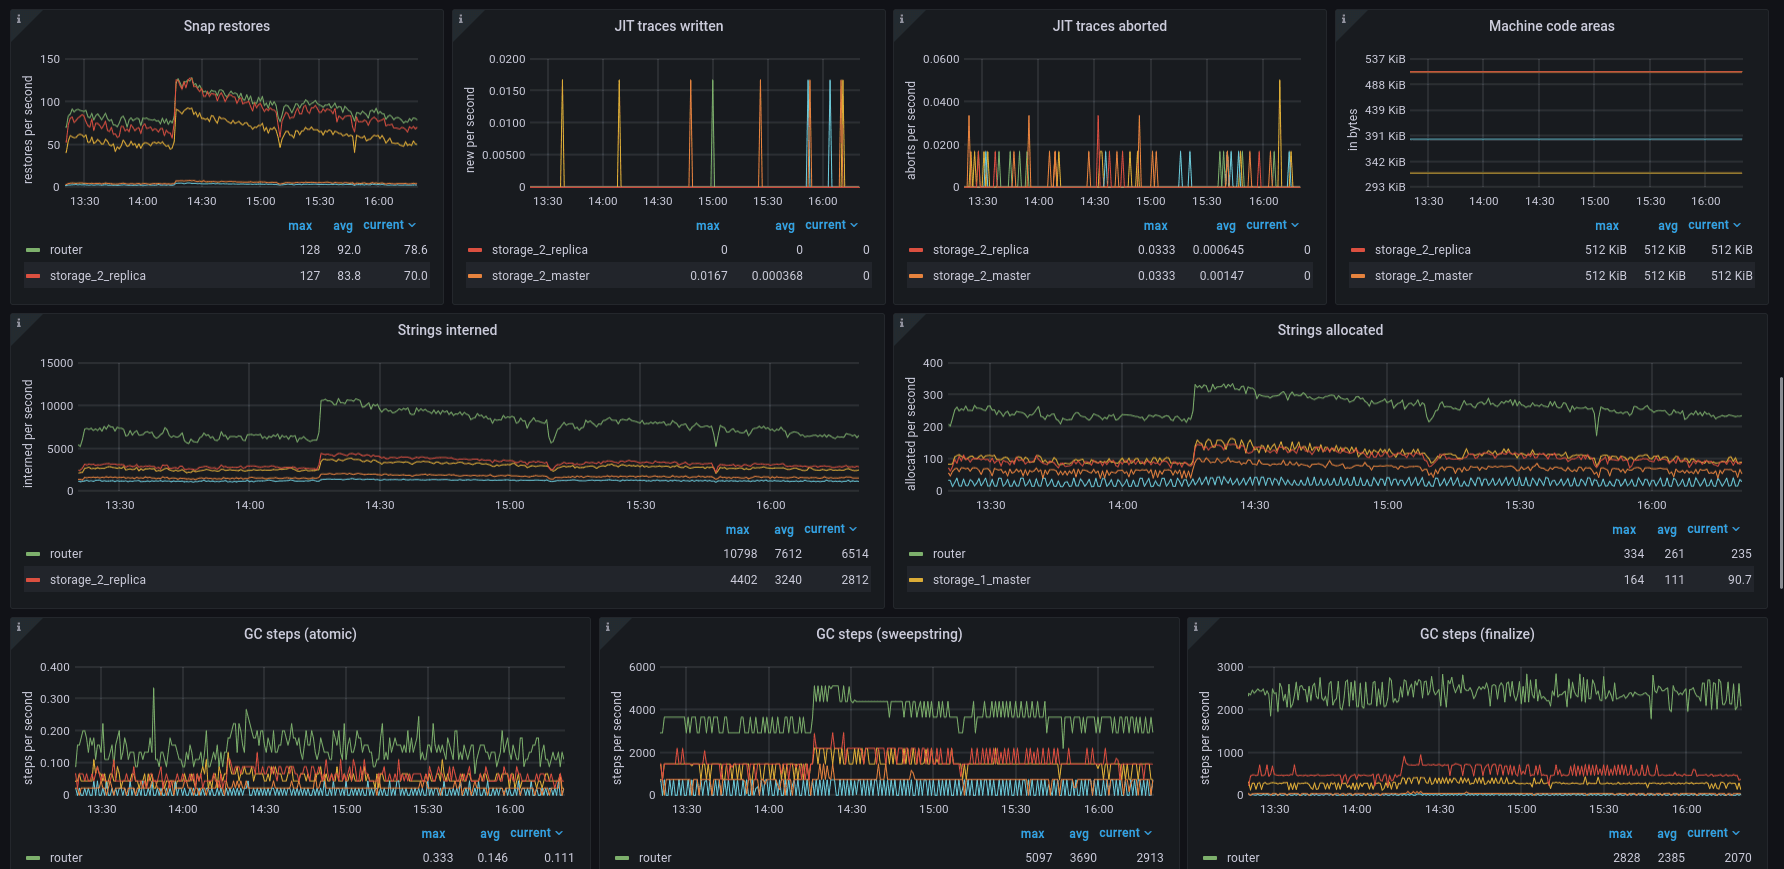
Since there are Prometheus and InfluxDB data source Grafana dashboards, you can use one of the following:
- Telegraf as a server agent for collecting metrics, InfluxDB as a time series database for storing metrics, and Grafana as a visualization platform.
- Prometheus as both a server agent for collecting metrics and a time series database for storing metrics, and Grafana as a visualization platform.
For issues related to setting up Prometheus, Telegraf, InfluxDB, or Grafana instances, refer to the corresponding project's documentation.
To collect metrics for Prometheus, first set up metrics output with
prometheus format. You can use the
roles.metrics-export configuration or set
up the Prometheus plugin manually.
To start collecting metrics, add a
job
to Prometheus configuration with each Tarantool instance URI as a target
and metrics path as it was configured on Tarantool instances:
global:scrape_interval: 5sevaluation_interval: 5sscrape_configs:- job_name: prometheusstatic_configs:- targets:- 127.0.0.1:8081- 127.0.0.1:8082- 127.0.0.1:8083- 127.0.0.1:8084- 127.0.0.1:8085metrics_path: "/metrics/prometheus"
To collect metrics for InfluxDB, use the Telegraf agent. First off,
configure Tarantool metrics output in json format with
roles.metrics-export configuration or
corresponding JSON plugin. To start
collecting metrics, add http
input
to Telegraf configuration including each Tarantool instance metrics URL:
[[inputs.http]]urls = ["http://example_project:8081/metrics/json","http://example_project:8082/metrics/json","http://example_project:8083/metrics/json","http://example_project:8084/metrics/json","http://example_project:8085/metrics/json"]timeout = "30s"tag_keys = ["metric_name","label_pairs_alias","label_pairs_quantile","label_pairs_path","label_pairs_method","label_pairs_status","label_pairs_operation","label_pairs_level","label_pairs_id","label_pairs_engine","label_pairs_name","label_pairs_index_name","label_pairs_delta","label_pairs_stream","label_pairs_thread","label_pairs_kind"]insecure_skip_verify = trueinterval = "10s"data_format = "json"name_prefix = "tarantool_"fieldpass = ["value"]
Be sure to include each label key as label_pairs_<key> to extract it
with the plugin. For example, if you use { state = 'ready' } labels
somewhere in metric collectors, add label_pairs_state tag key.
Open Grafana import menu.
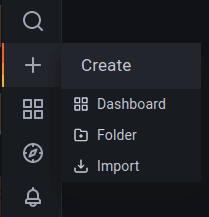
To import a specific dashboard, choose one of the following options:
- paste the dashboard id (
21474for Prometheus dashboard,21484for InfluxDB dashboard) - paste a link to the dashboard (https://grafana.com/grafana/dashboards/21474 for Prometheus dashboard, https://grafana.com/grafana/dashboards/21484 for InfluxDB dashboard)
- paste the dashboard JSON file contents
- upload the dashboard JSON file
Set dashboard name, folder and uid (if needed).
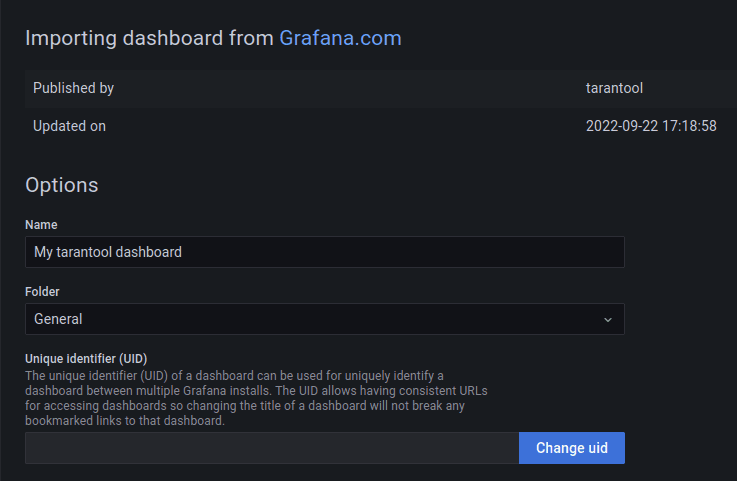
You can choose the data source and data source variables after import.

- If there are no data on the graphs, make sure that you picked datasource and job/measurement correctly.
- If there are no data on the graphs, make sure that you have
infogroup of Tarantool metrics (in particular,tnt_info_uptime). - If some Prometheus graphs show no data because of
parse error: missing unit character in duration, ensure that you use Grafana 7.2 or newer. - If some Prometheus graphs display
parse error: bad duration syntax "1m0"or similar error, you need to update your Prometheus version. See grafana/grafana#44542 for more details.