Web UI
В этой главе рассказано, как получить доступ к веб-интерфейсу TDG и авторизоваться в системе. Кроме того, в главе описаны элементы управления и функции, представленные в веб-интерфейсе.
В примере ниже описана ситуация, когда авторизация в системе TDG уже включена. Подробнее о том, как включить авторизацию, вы можете узнать из руководства по авторизации.
Signing in
Чтобы получить доступ к веб-интерфейсу TDG, выполните следующие шаги:
Contact your administrator to get your credentials:
Username: login that is automatically generated when the administrator creates a user profile. For example,
ui8896orgz1200.Password: automatically generated when the administrator creates a user profile.
TDG server address:
http://<address>:<http_port>, is set by the administrator in the configuration file. This guide uses thehttp://172.19.0.2:8080server address as an example.
В браузере введите адрес сервера TDG, чтобы открыть диалоговое окно авторизации.
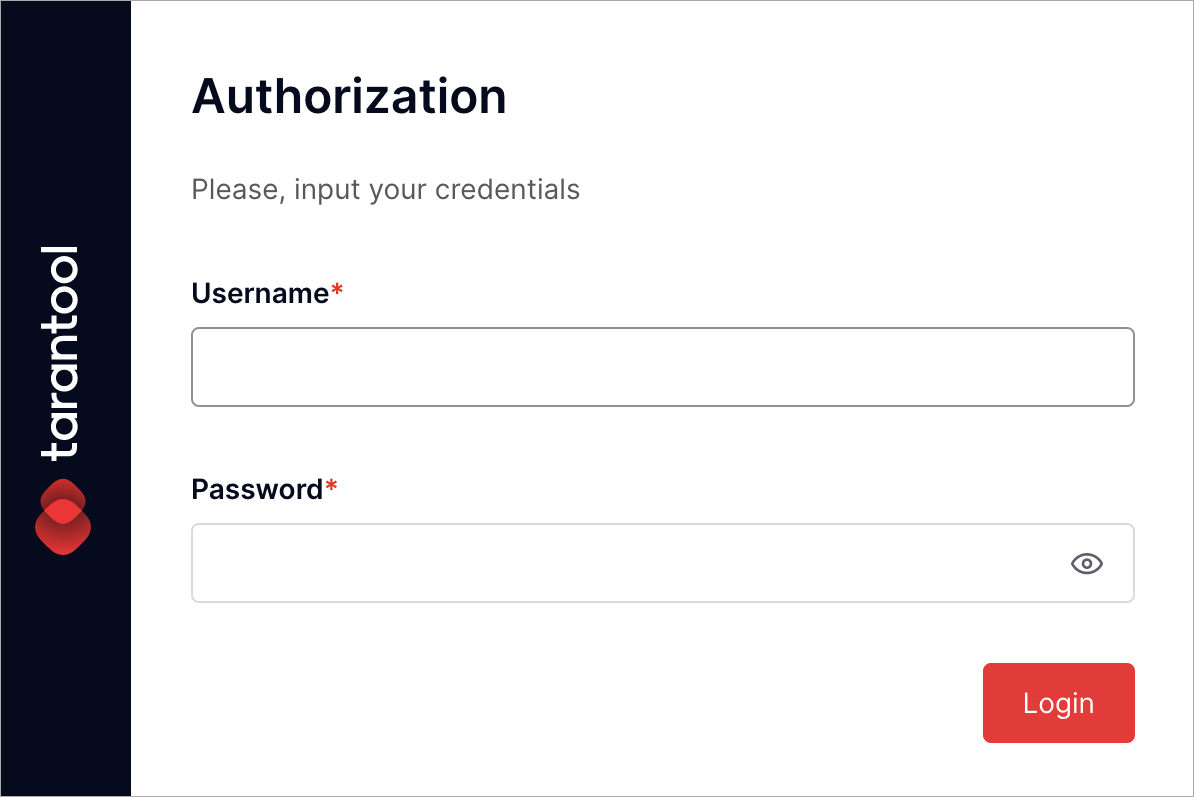
Введите учетные данные: в поле Username – имя пользователя, а в поле Password – пароль.
Click Login.
Во время авторизации система TDG проверяет правильность ваших учетных данных и права доступа к определенным вкладкам TDG. После успешной авторизации вы увидите интерфейс TDG с доступом только к определенным вкладкам. Набор вкладок зависит от роли пользователя, которую вам назначил администратор.
Если в учетных данных окажется опечатка, TDG не сможет вас идентифицировать. В этом случае появится сообщение “Authentication failed”:
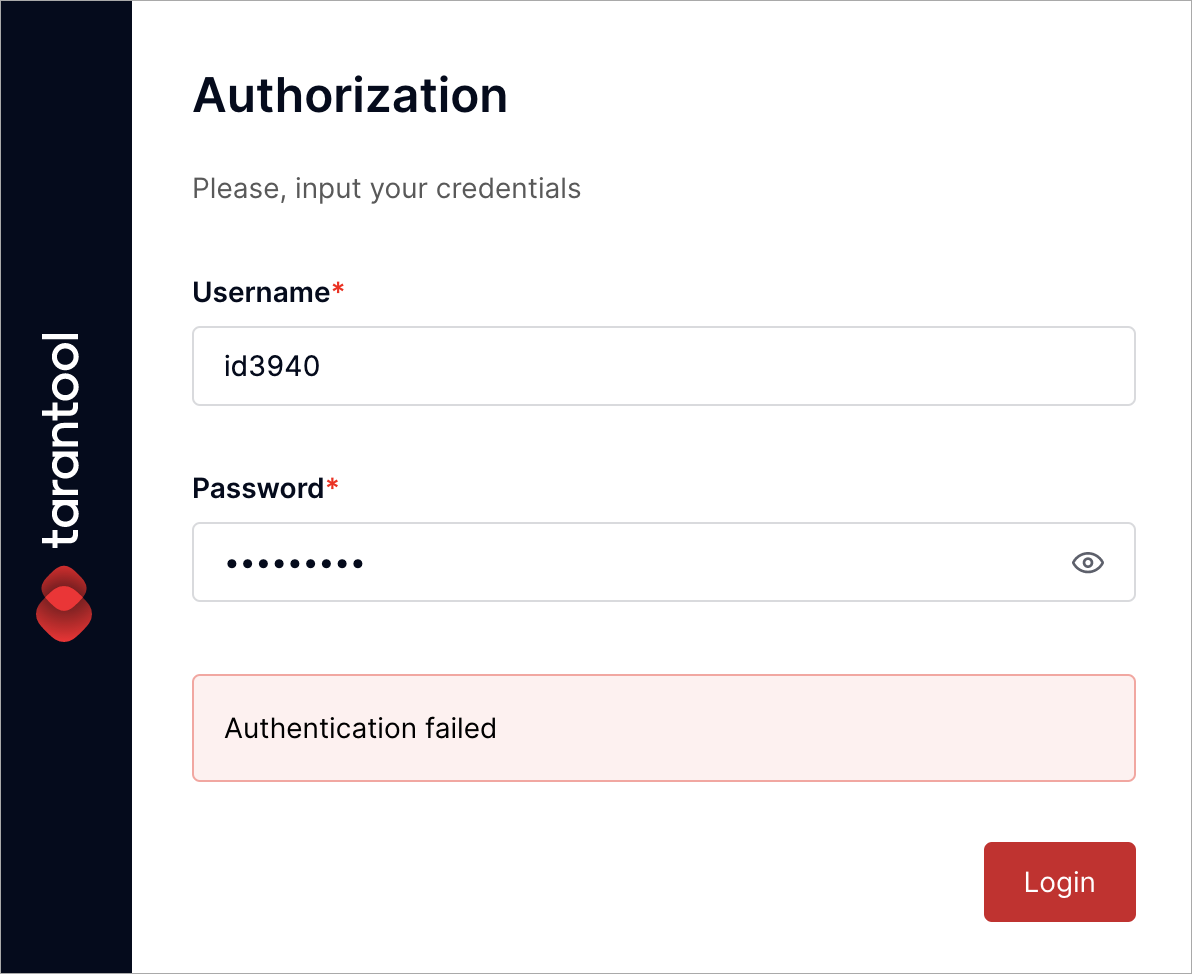
Try to input your credentials one more time.
Web UI overview
Интерфейс TDG состоит из двух частей:
Панель вкладок отображает список вкладок для навигации по разделам TDG.
Working area: displays the contents of the selected tab.
Tab pane
The contents of the tab pane vary depending on the user role. Users with the “admin” and “supervisor” rights can see all tabs. Users with the access rights of the “user” role have access to a limited set of tabs.
At the bottom of the page, there is a Collapse menu button. Click it to hide the full tab pane view.
The tab pane consists of the following tabs:
Cluster |
Cluster configuration and administration. |
Configuration files |
Управление параметрами конфигурации TDG. |
Test |
Sending test queries in JSON or XML (SOAP) format. |
GraphQL |
Sending queries in GraphQL format. |
Sandbox |
Отладка кода в окружении sandbox. |
Model |
Актуальная модель данных, загруженная в систему. |
Repair Queues: Input |
Repair queue for the uploaded objects. |
Repair Queues: Output |
Repair queue for the objects replicated to external systems. |
Repair Queues: Jobs |
Repair queue for pending jobs that ended with an error. |
Logger |
Event log. |
Audit Log |
Audit log. |
Tasks |
Task management. |
Data types |
Data types that are represented in the uploaded data model. |
Connectors |
Connector creation and management. |
Migrations |
Управление миграциями и их применение. Доступно с версии 2.18.0. |
Settings |
System settings management. |
Doc |
Версия документации TDG на английском языке, доступная локально из разворачиваемого пакета TDG. Таким образом, она содержит только ту информацию, которая была опубликована до формирования пакета. Более актуальную документацию на русском языке вы можете найти на сайте tarantool.io. |
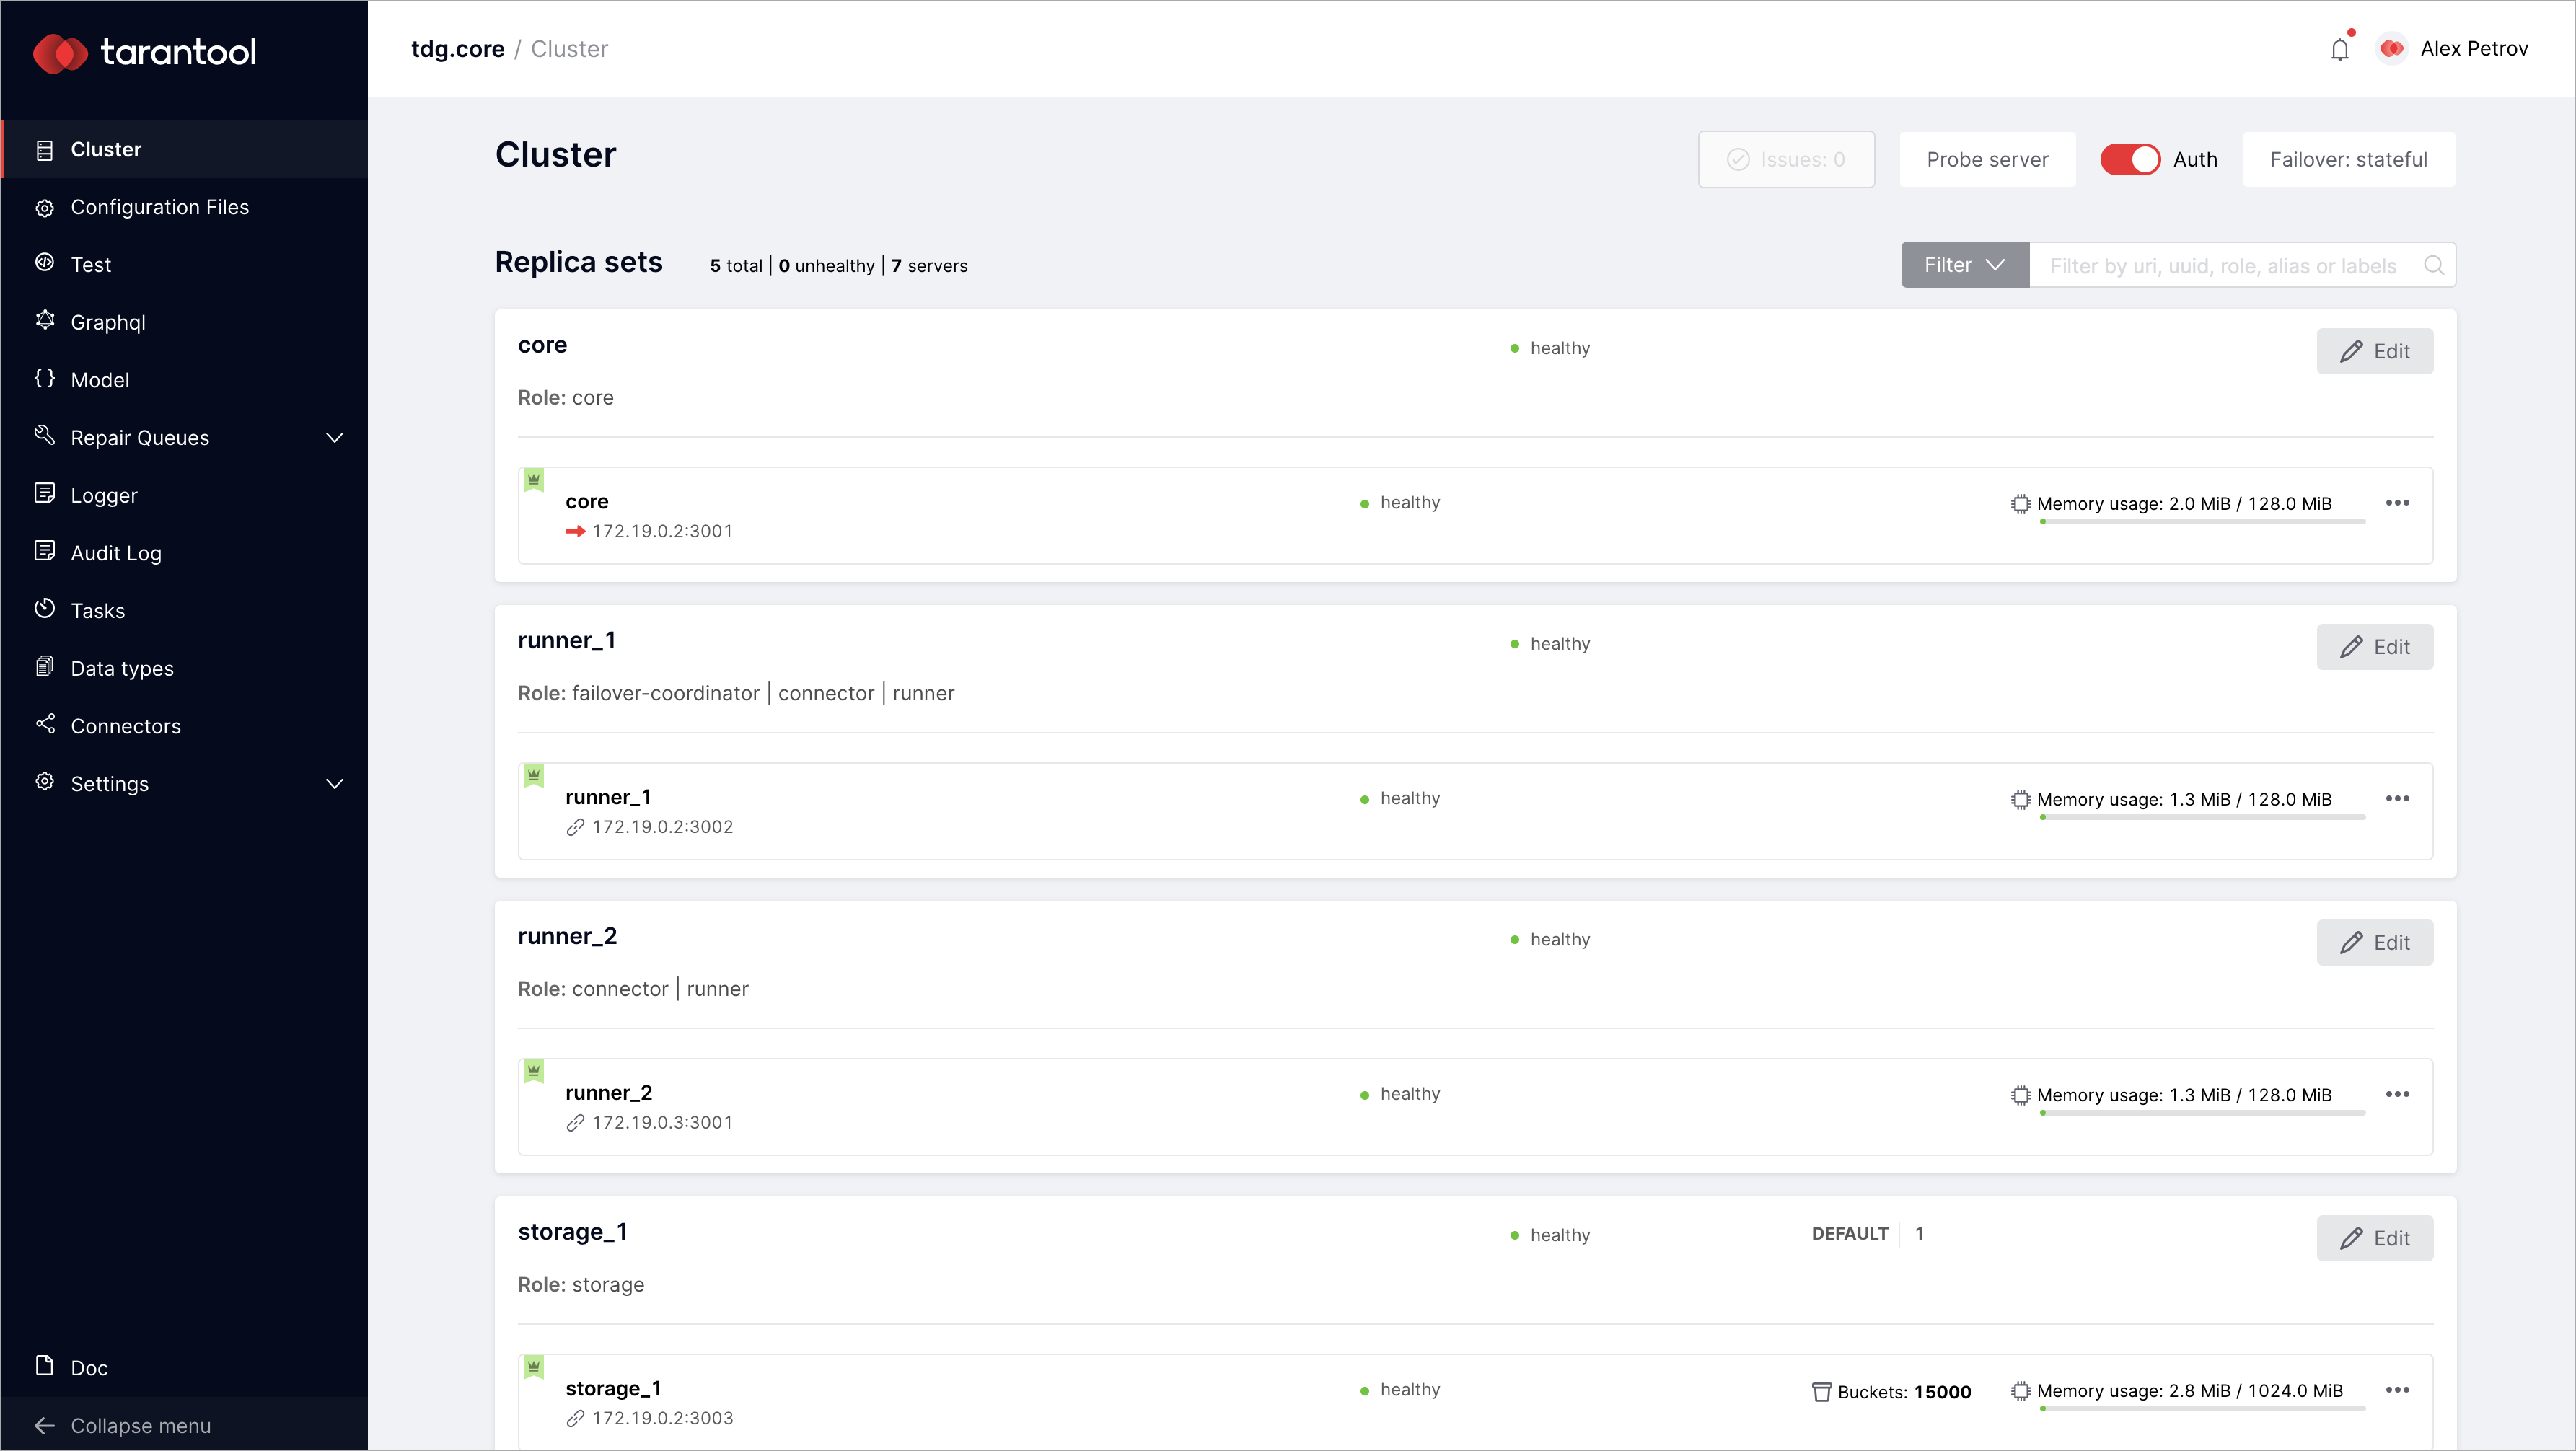
Cluster tab
На вкладке Cluster отображается текущий статус кластера экземпляров TDG. На этой вкладке вы можете администрировать кластер через веб-интерфейс. Элементы управления можно разделить на несколько групп:
Replica sets
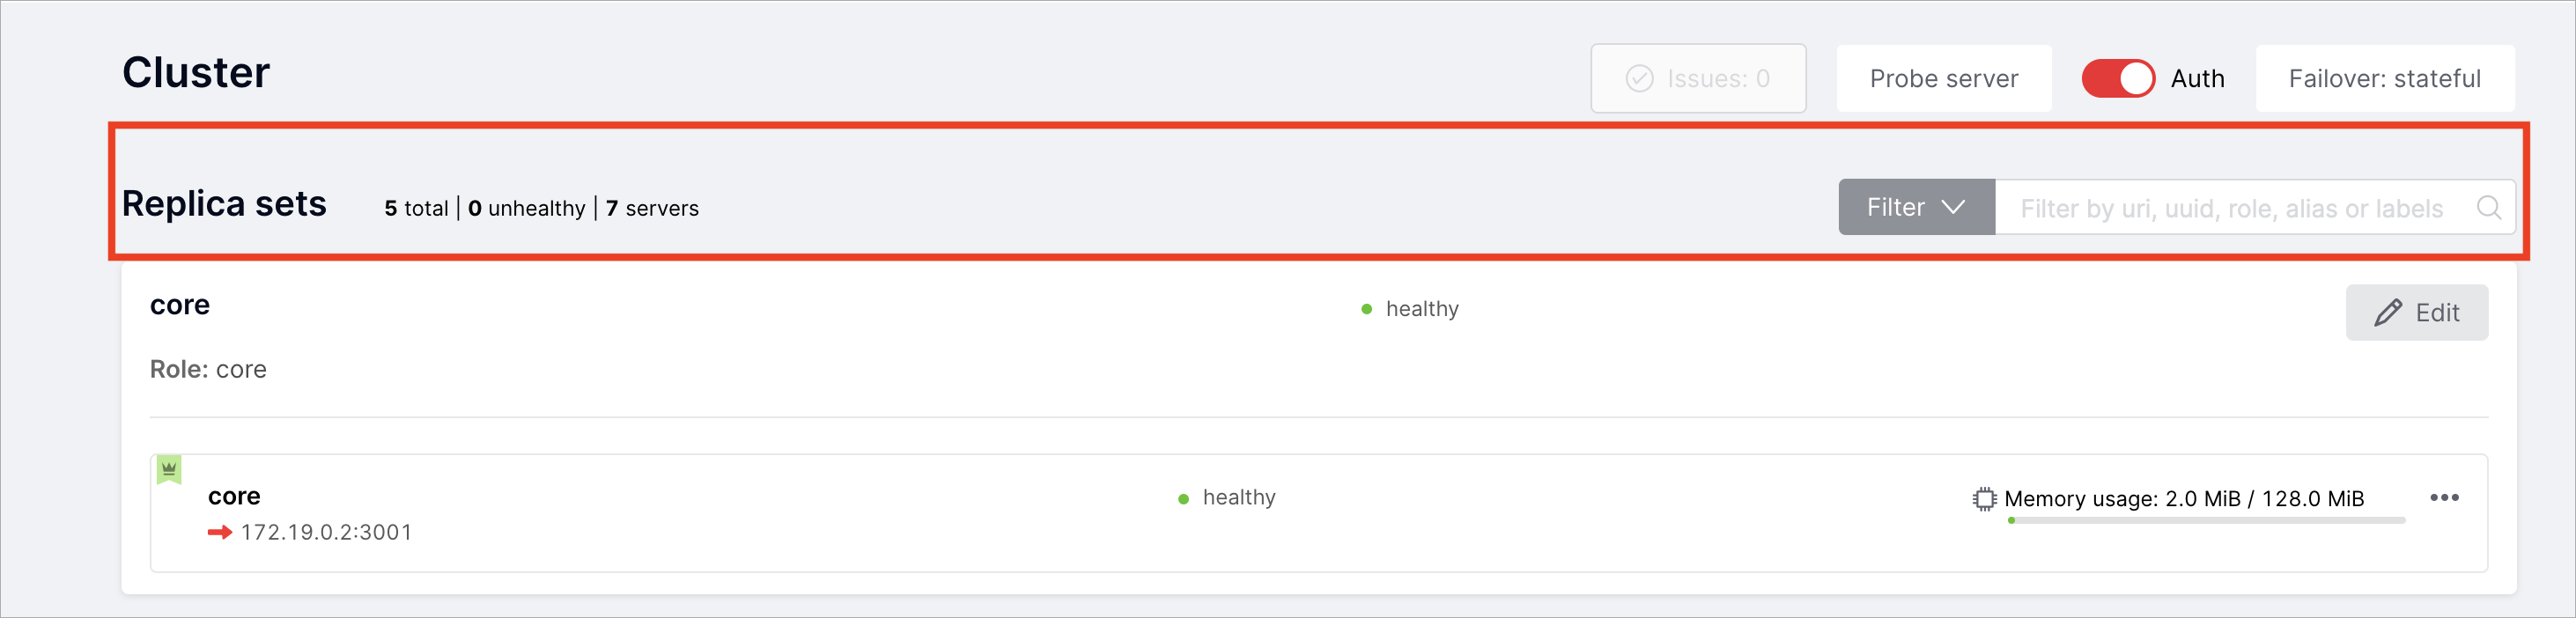
In the highlighted area, you can see general replica set statistics:
Total |
Total number of replica sets in the cluster. |
Unhealthy |
Number of replica sets with the “unhealthy” status. |
Servers |
Общее количество экземпляров TDG. |
Filter |
A dropdown menu to filter replica sets by status or cluster role. |
Search box |
A search box to display replica sets filtered by URI, UUID, role, alias, or labels. |
Replica set widget
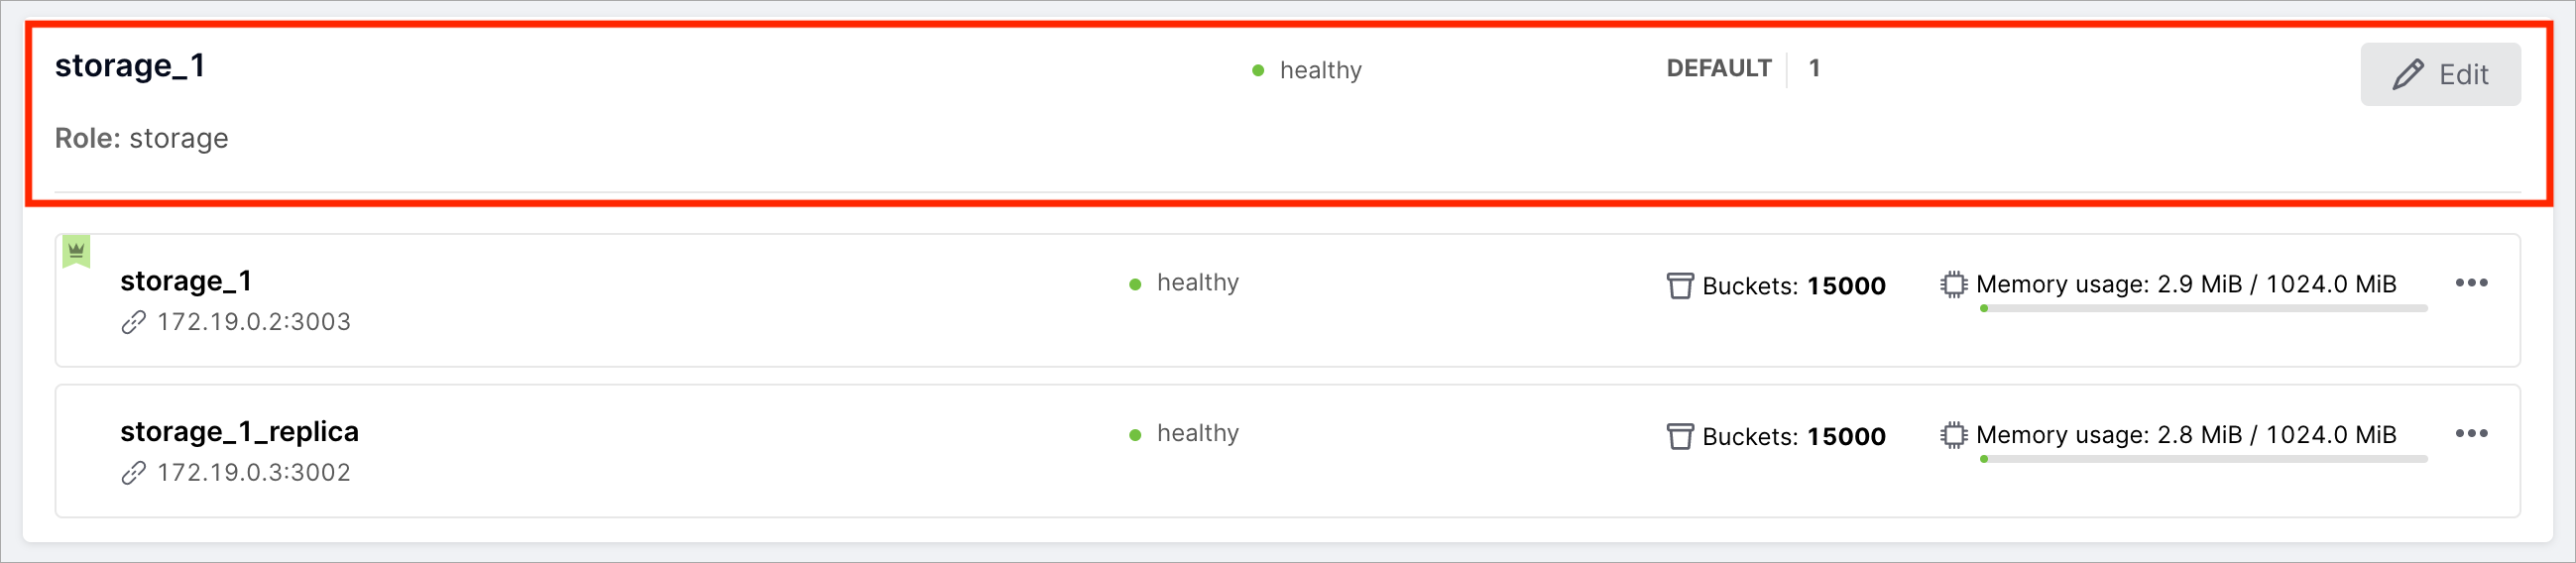
The following statistics are available in the replica set widget:
Name and role |
For example, replica set “storage_1” with the role “storage”. |
Status |
“Healthy” means the current replica set functions properly. “Unhealthy” means the current replica set is not available or does not function properly. |
Storage group and replica set weight |
Only for replica sets with the “storage” role. For example, storage group “default”, replica set weight “1”. |
Edit button |
Opens a dialog where you can edit the parameters of the replica set. |
Instances widgets |
The widgets of the instances included in this replica set. |
Instance widget
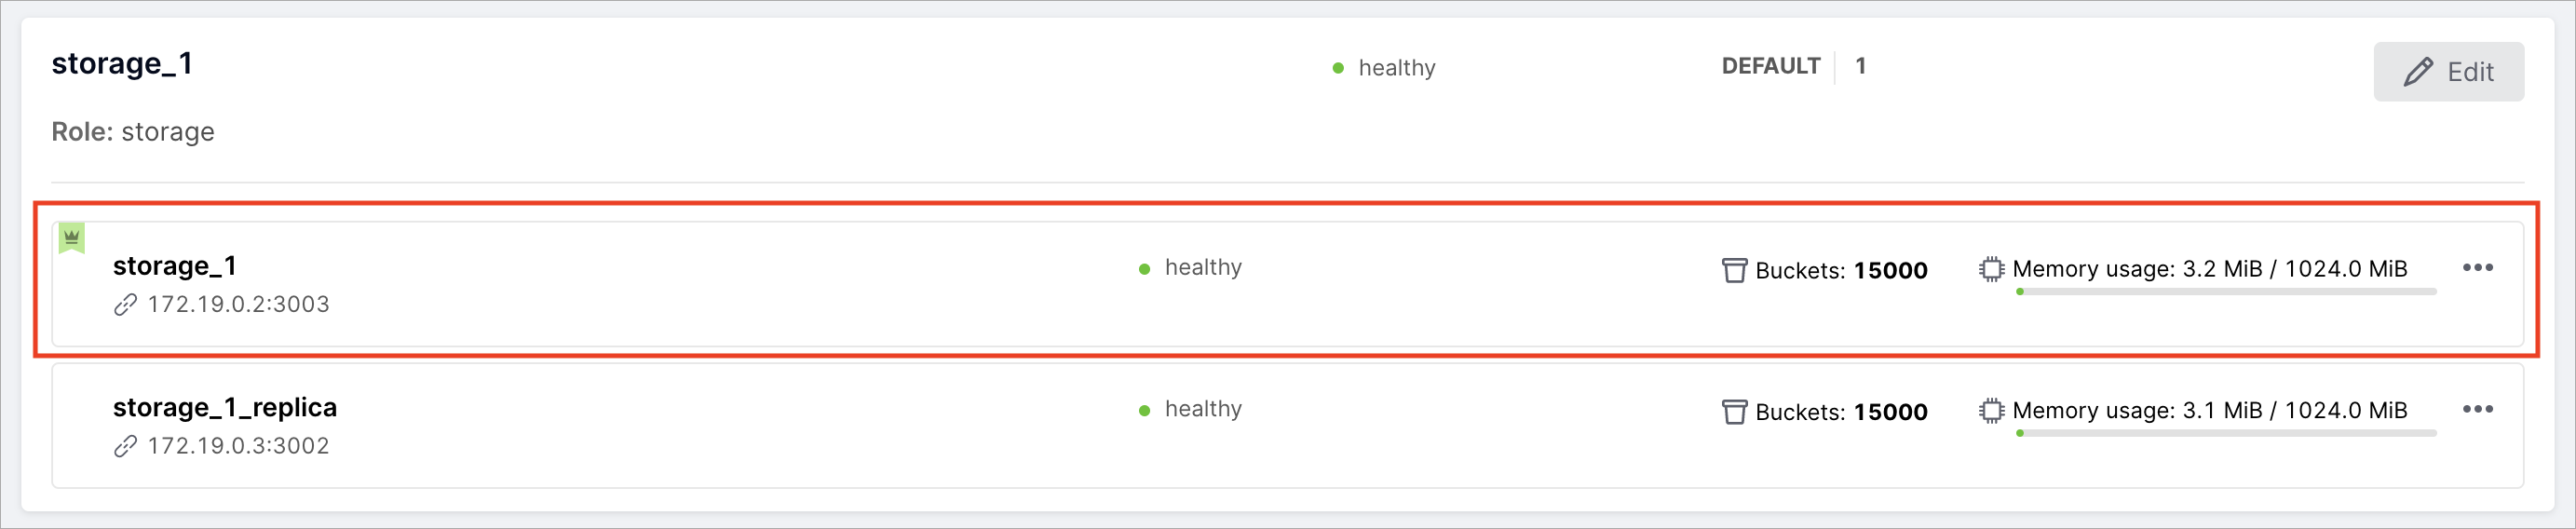
The widget of the instance is in the highlighted area. It allows you to see the following information about the instance:
Instance name |
For example, “storage_1” or “storage_1_replica”. |
URI |
Instance URI for binary port access. Is set in the cluster configuration via the |
Status |
“Healthy” means the current instance functions properly. “Unhealthy” means the current instance is not available or does not function properly. |
Leader indicator |
Indicates if the instance is the leader in the replica set. |
Memory usage indicator |
The actual memory used / memory limit set for the instance. For example, 3.3 MiB / 1024.0 MiB. |
Virtual buckets indicator |
Indicates the number of virtual buckets on the instance. Only for replica sets with the “storage” role. |
|
Options to see instance details, promote the instance as a leader, disable or expel the instance. |
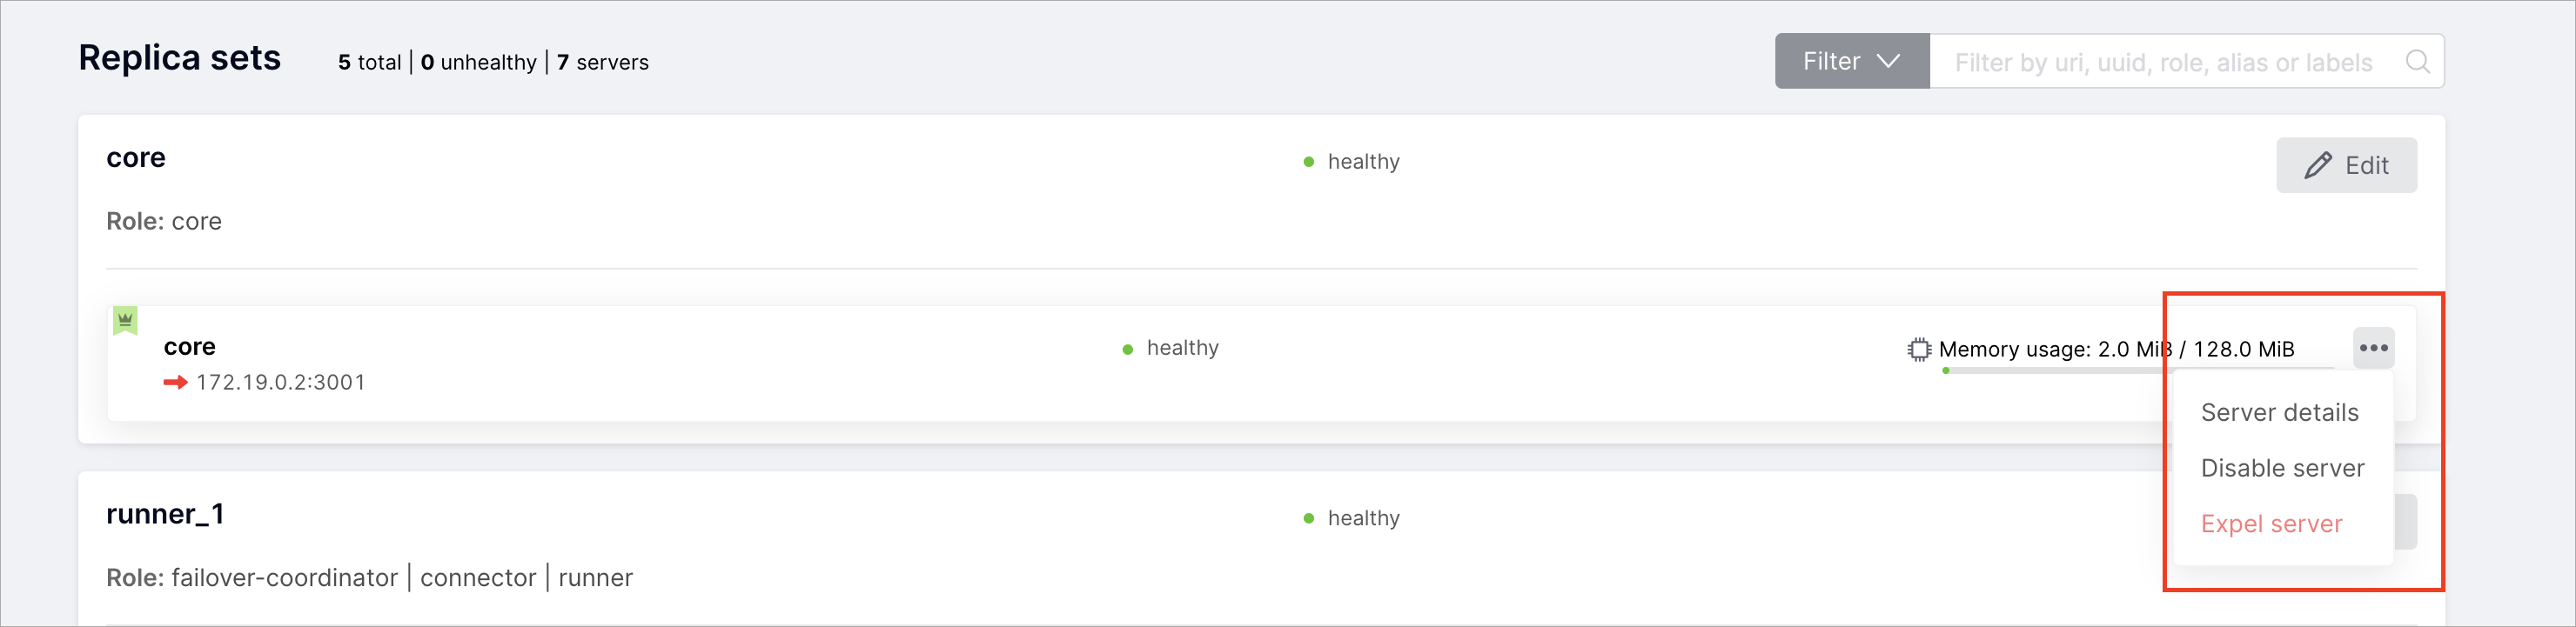
Instance details
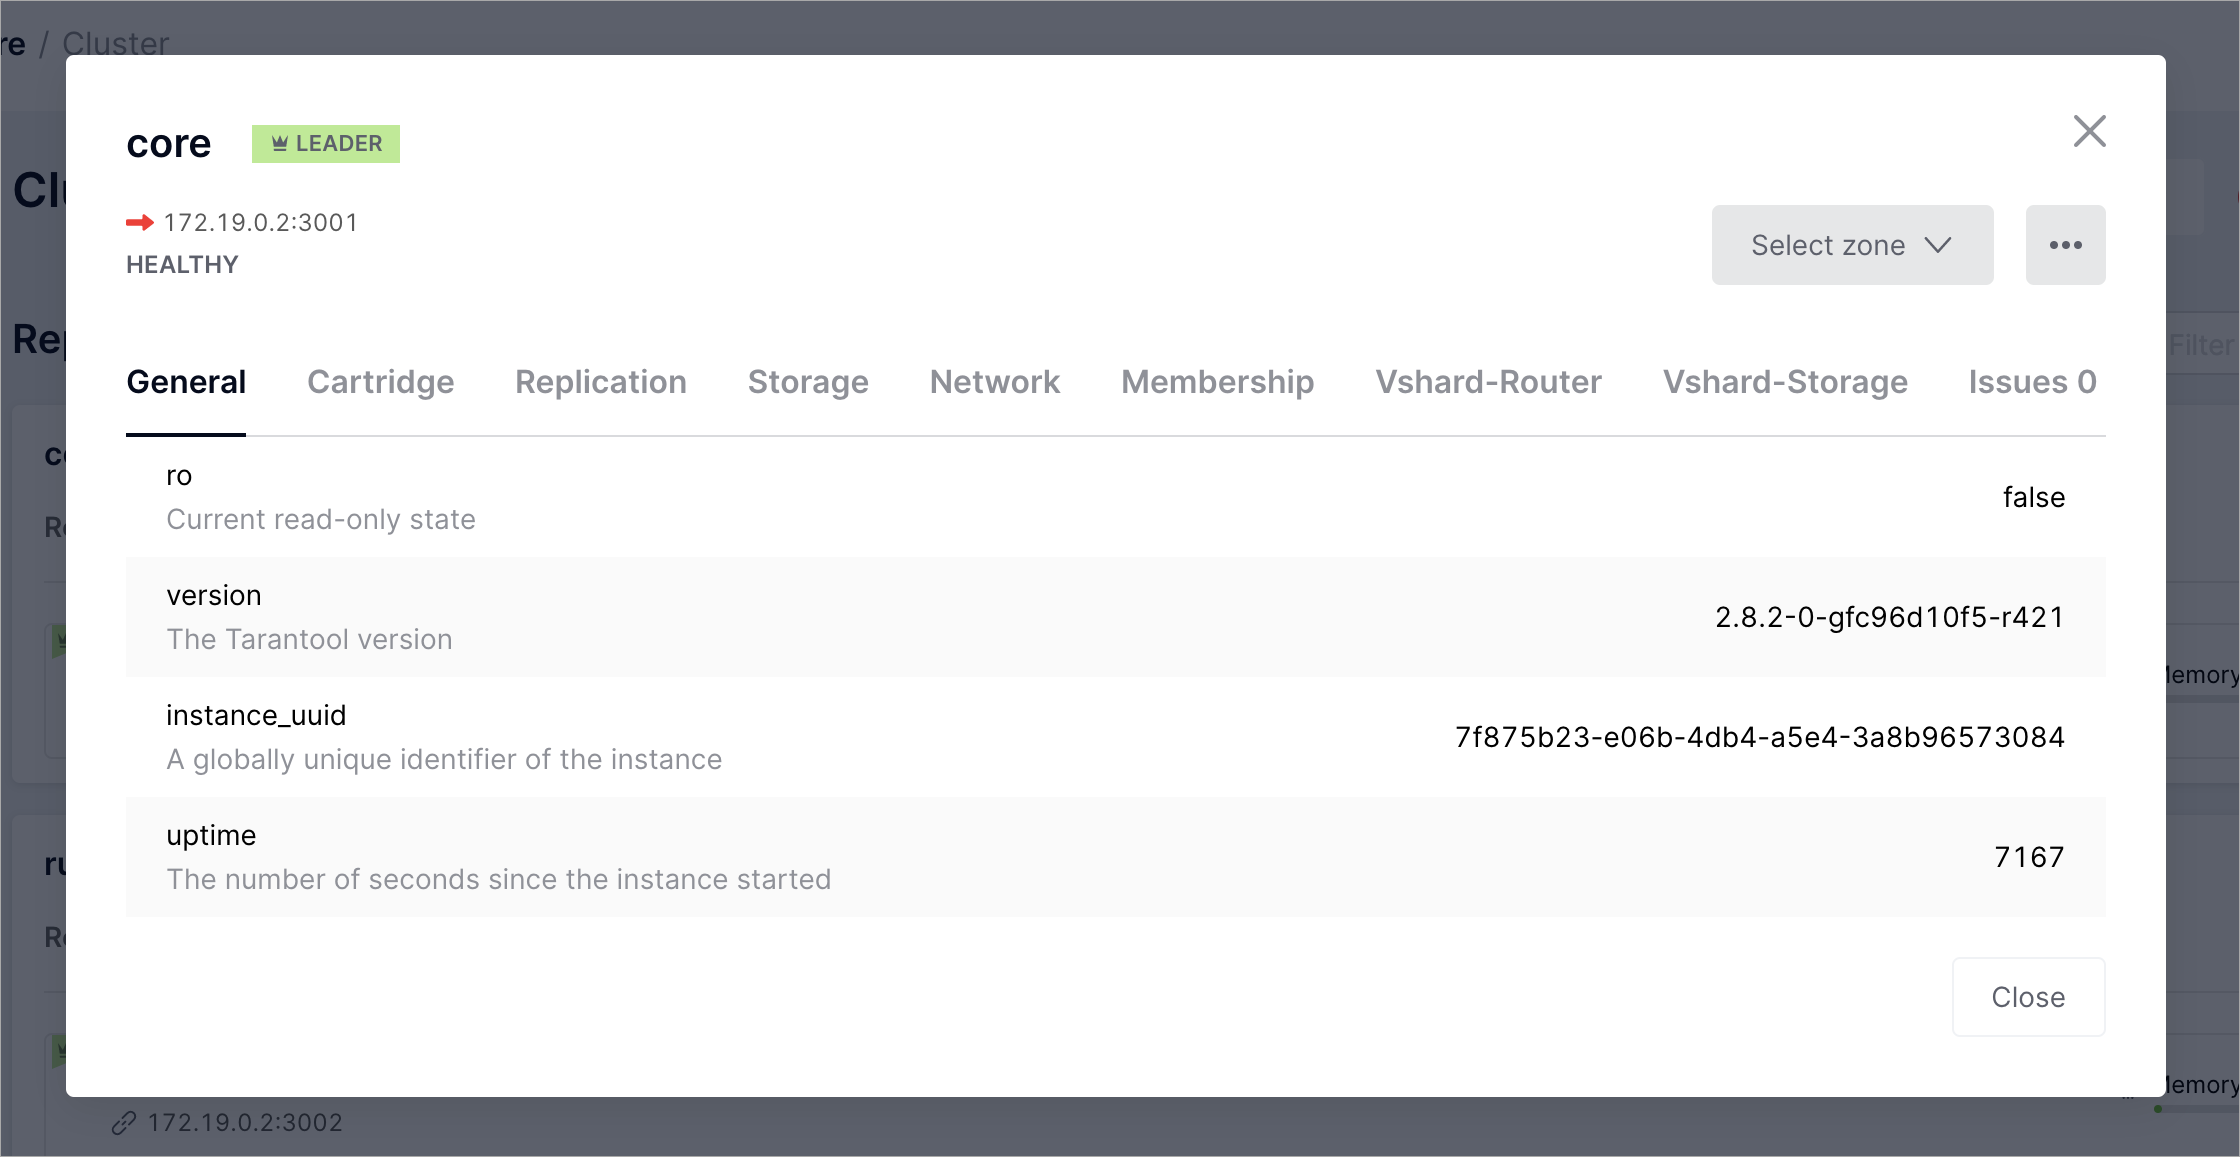
For each instance, you can view detailed information about its parameters in read-only mode. On the Cluster tab of the instance, click … > Server details:
You will see a pop-up window with detailed information about the instance parameters:
More functions
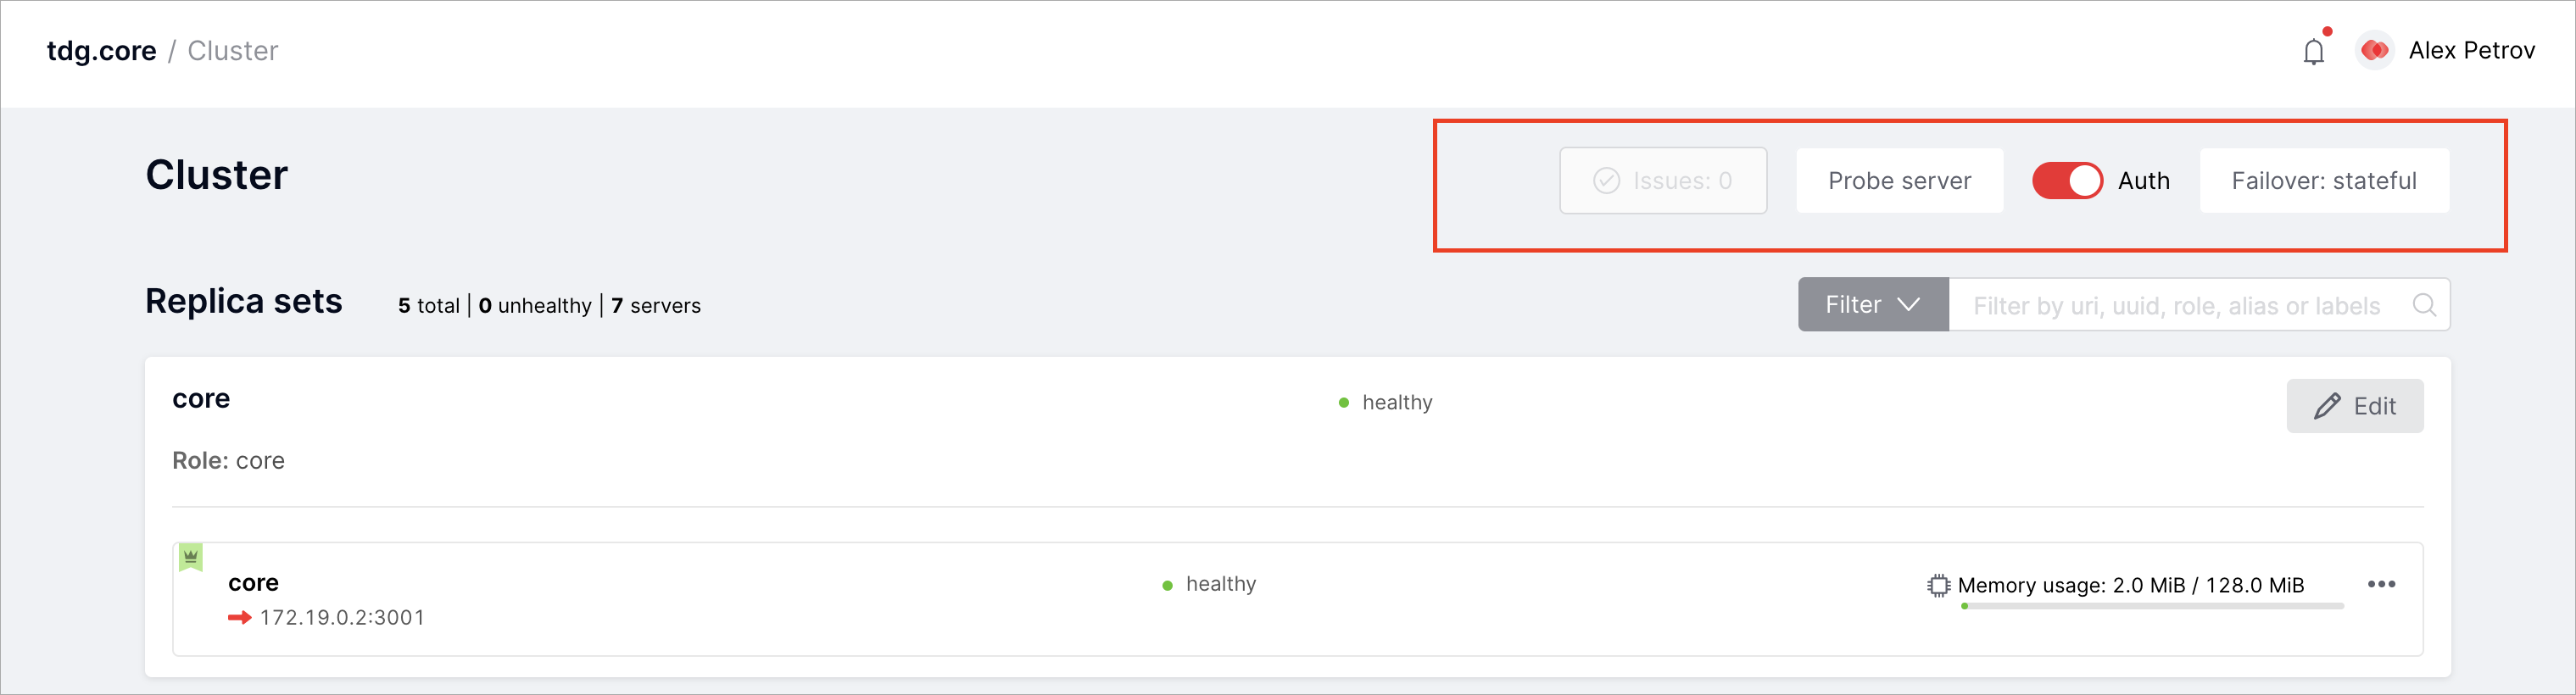
Several more TDG functions are also available on the Cluster tab:
Issues |
The history of issues occurring in the cluster operation. |
Probe server |
Manual server availability check. Used when configuring a cluster. |
Auth |
Enable and disable mandatory authorization mode. |
Failover: disabled/eventual/stateful |
Switch for automatic recovery mode after failure. |
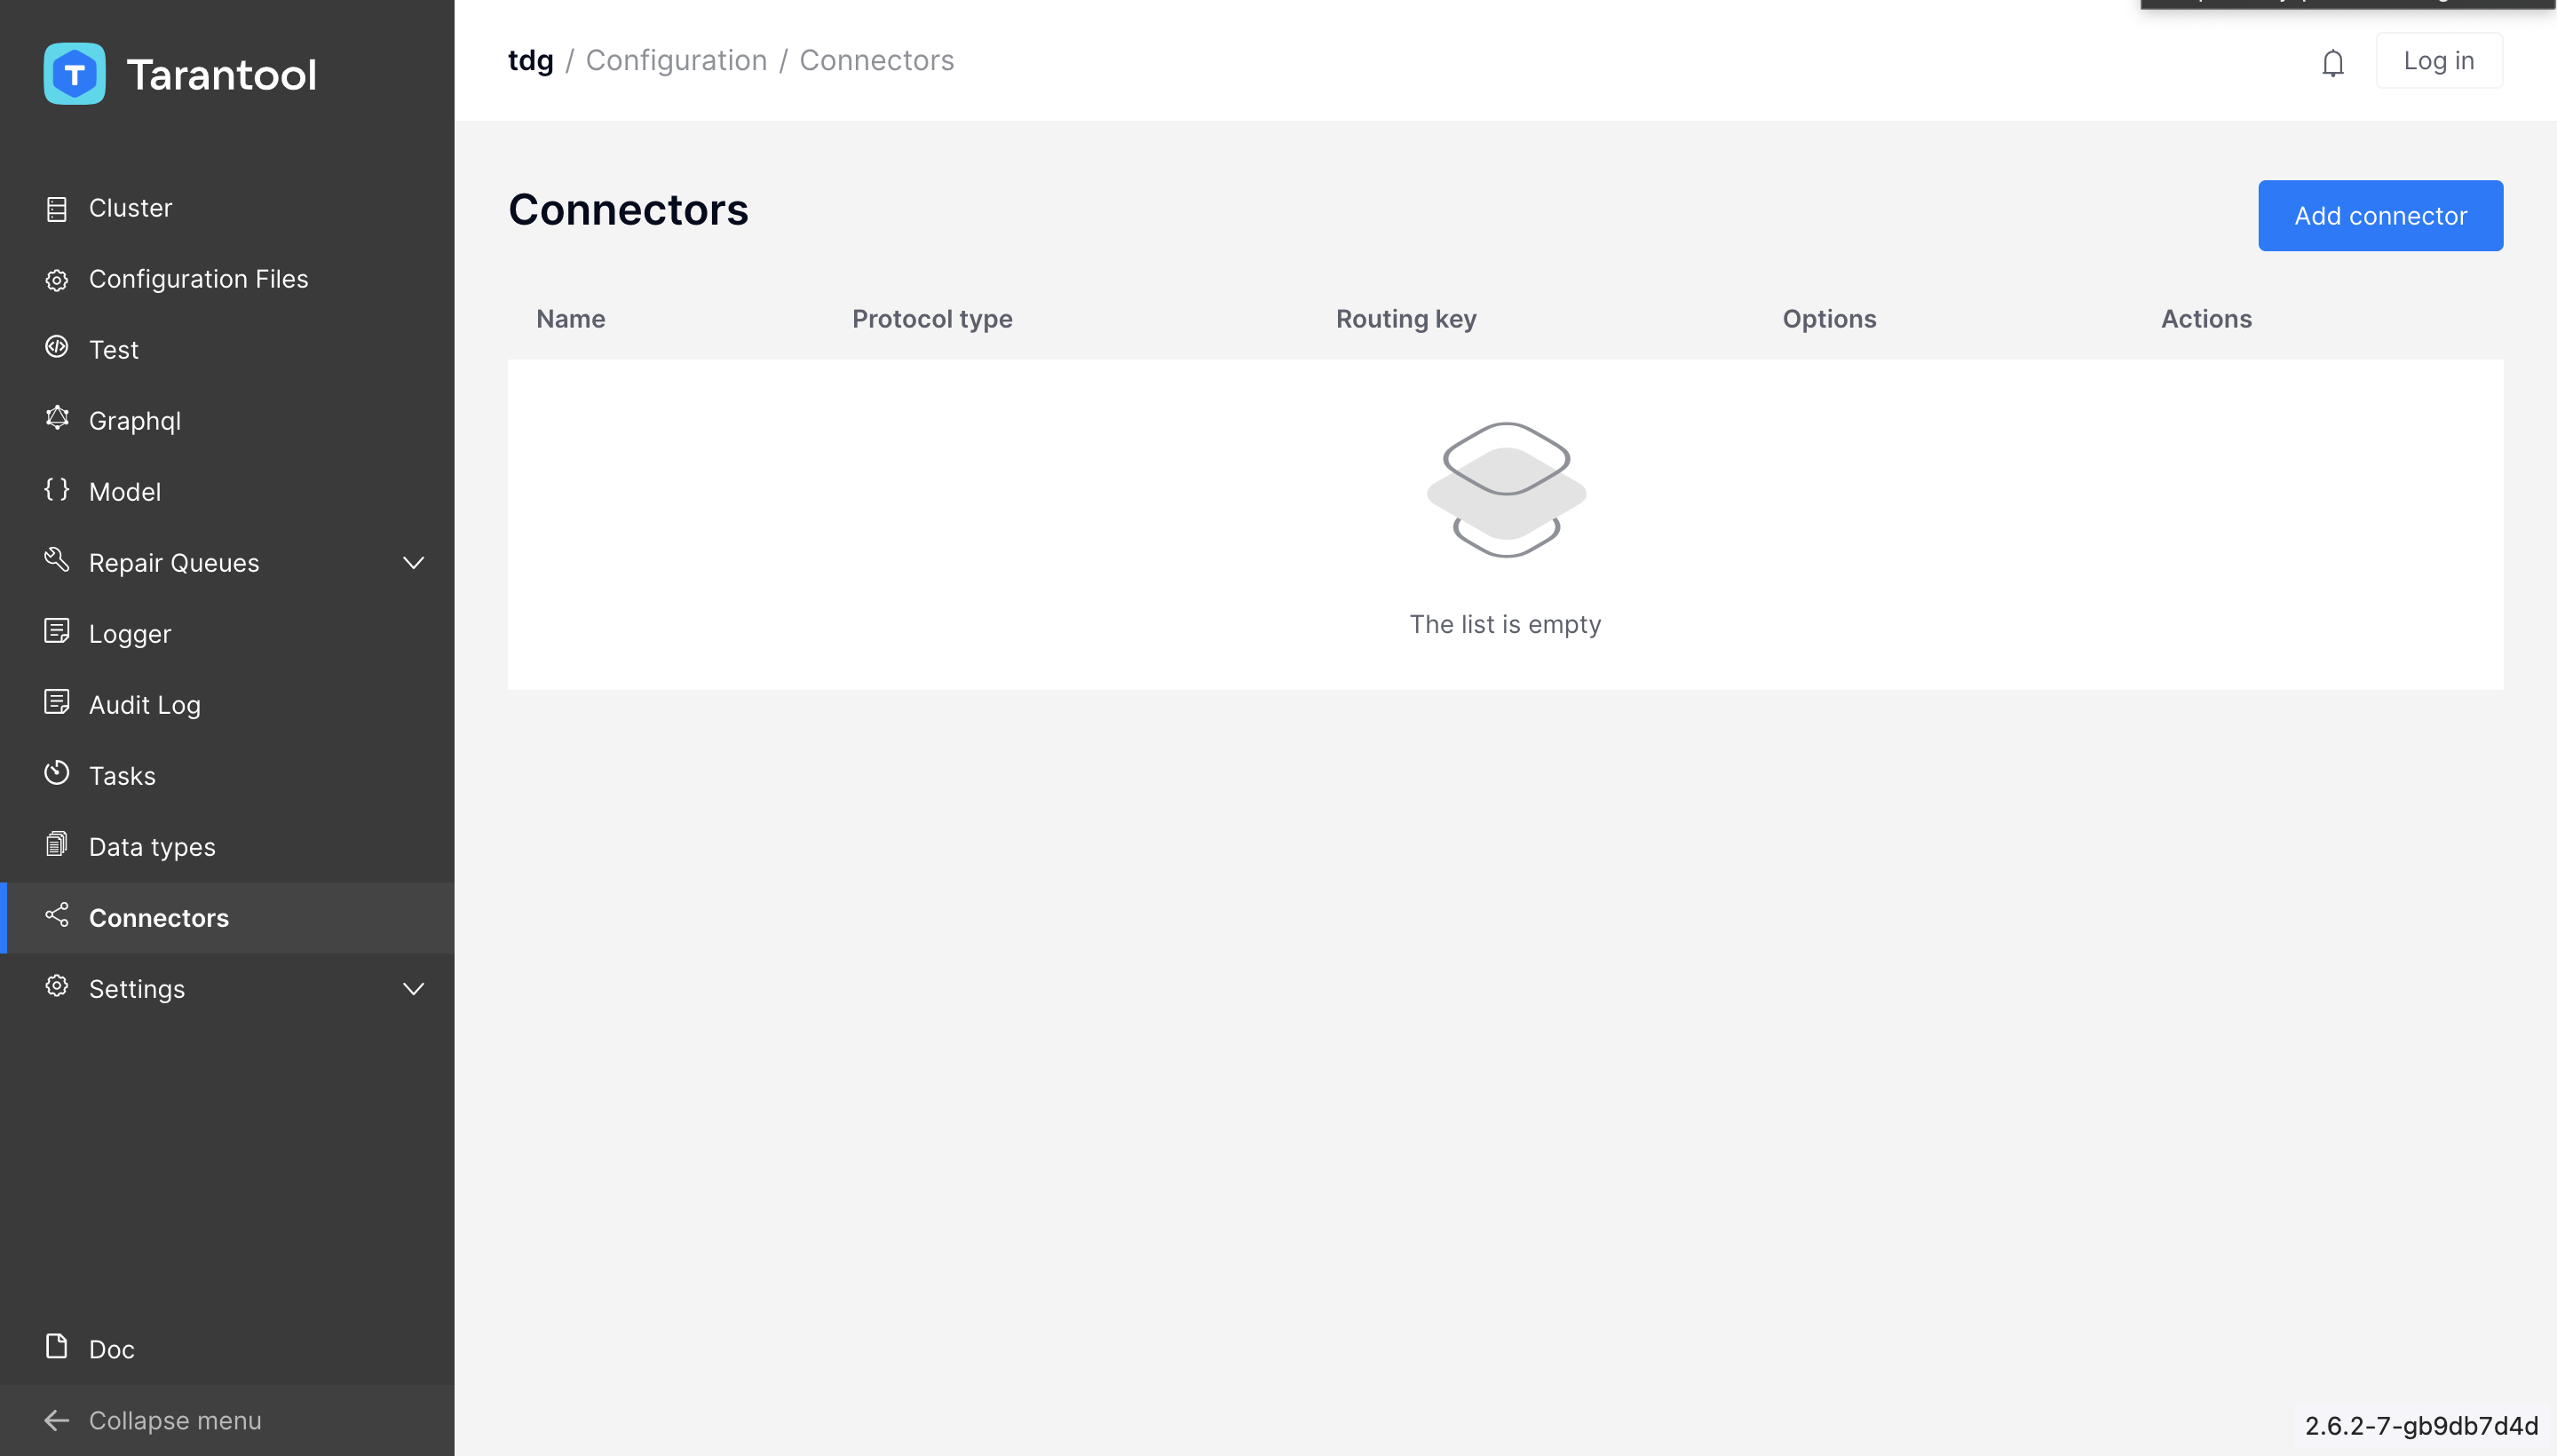
Вкладка Connectors
В TDG роль connector предназначена для соединения и обмена данными с внешними системами.
Для подключения доступно несколько протоколов соединения:
http– запросы в формате JSON по HTTP;soap– запросы в формате XML (SOAP) по HTTP;kafka– для интеграции с шиной данных Apache Kafka;tarantool_protocol– коннектор iproto.
На вкладке Connectors отображается список всех input-коннекторов. Здесь вы можете создавать новые коннекторы и управлять их. Ниже описаны доступные сценарии работы с вкладкой:
Создание коннектора
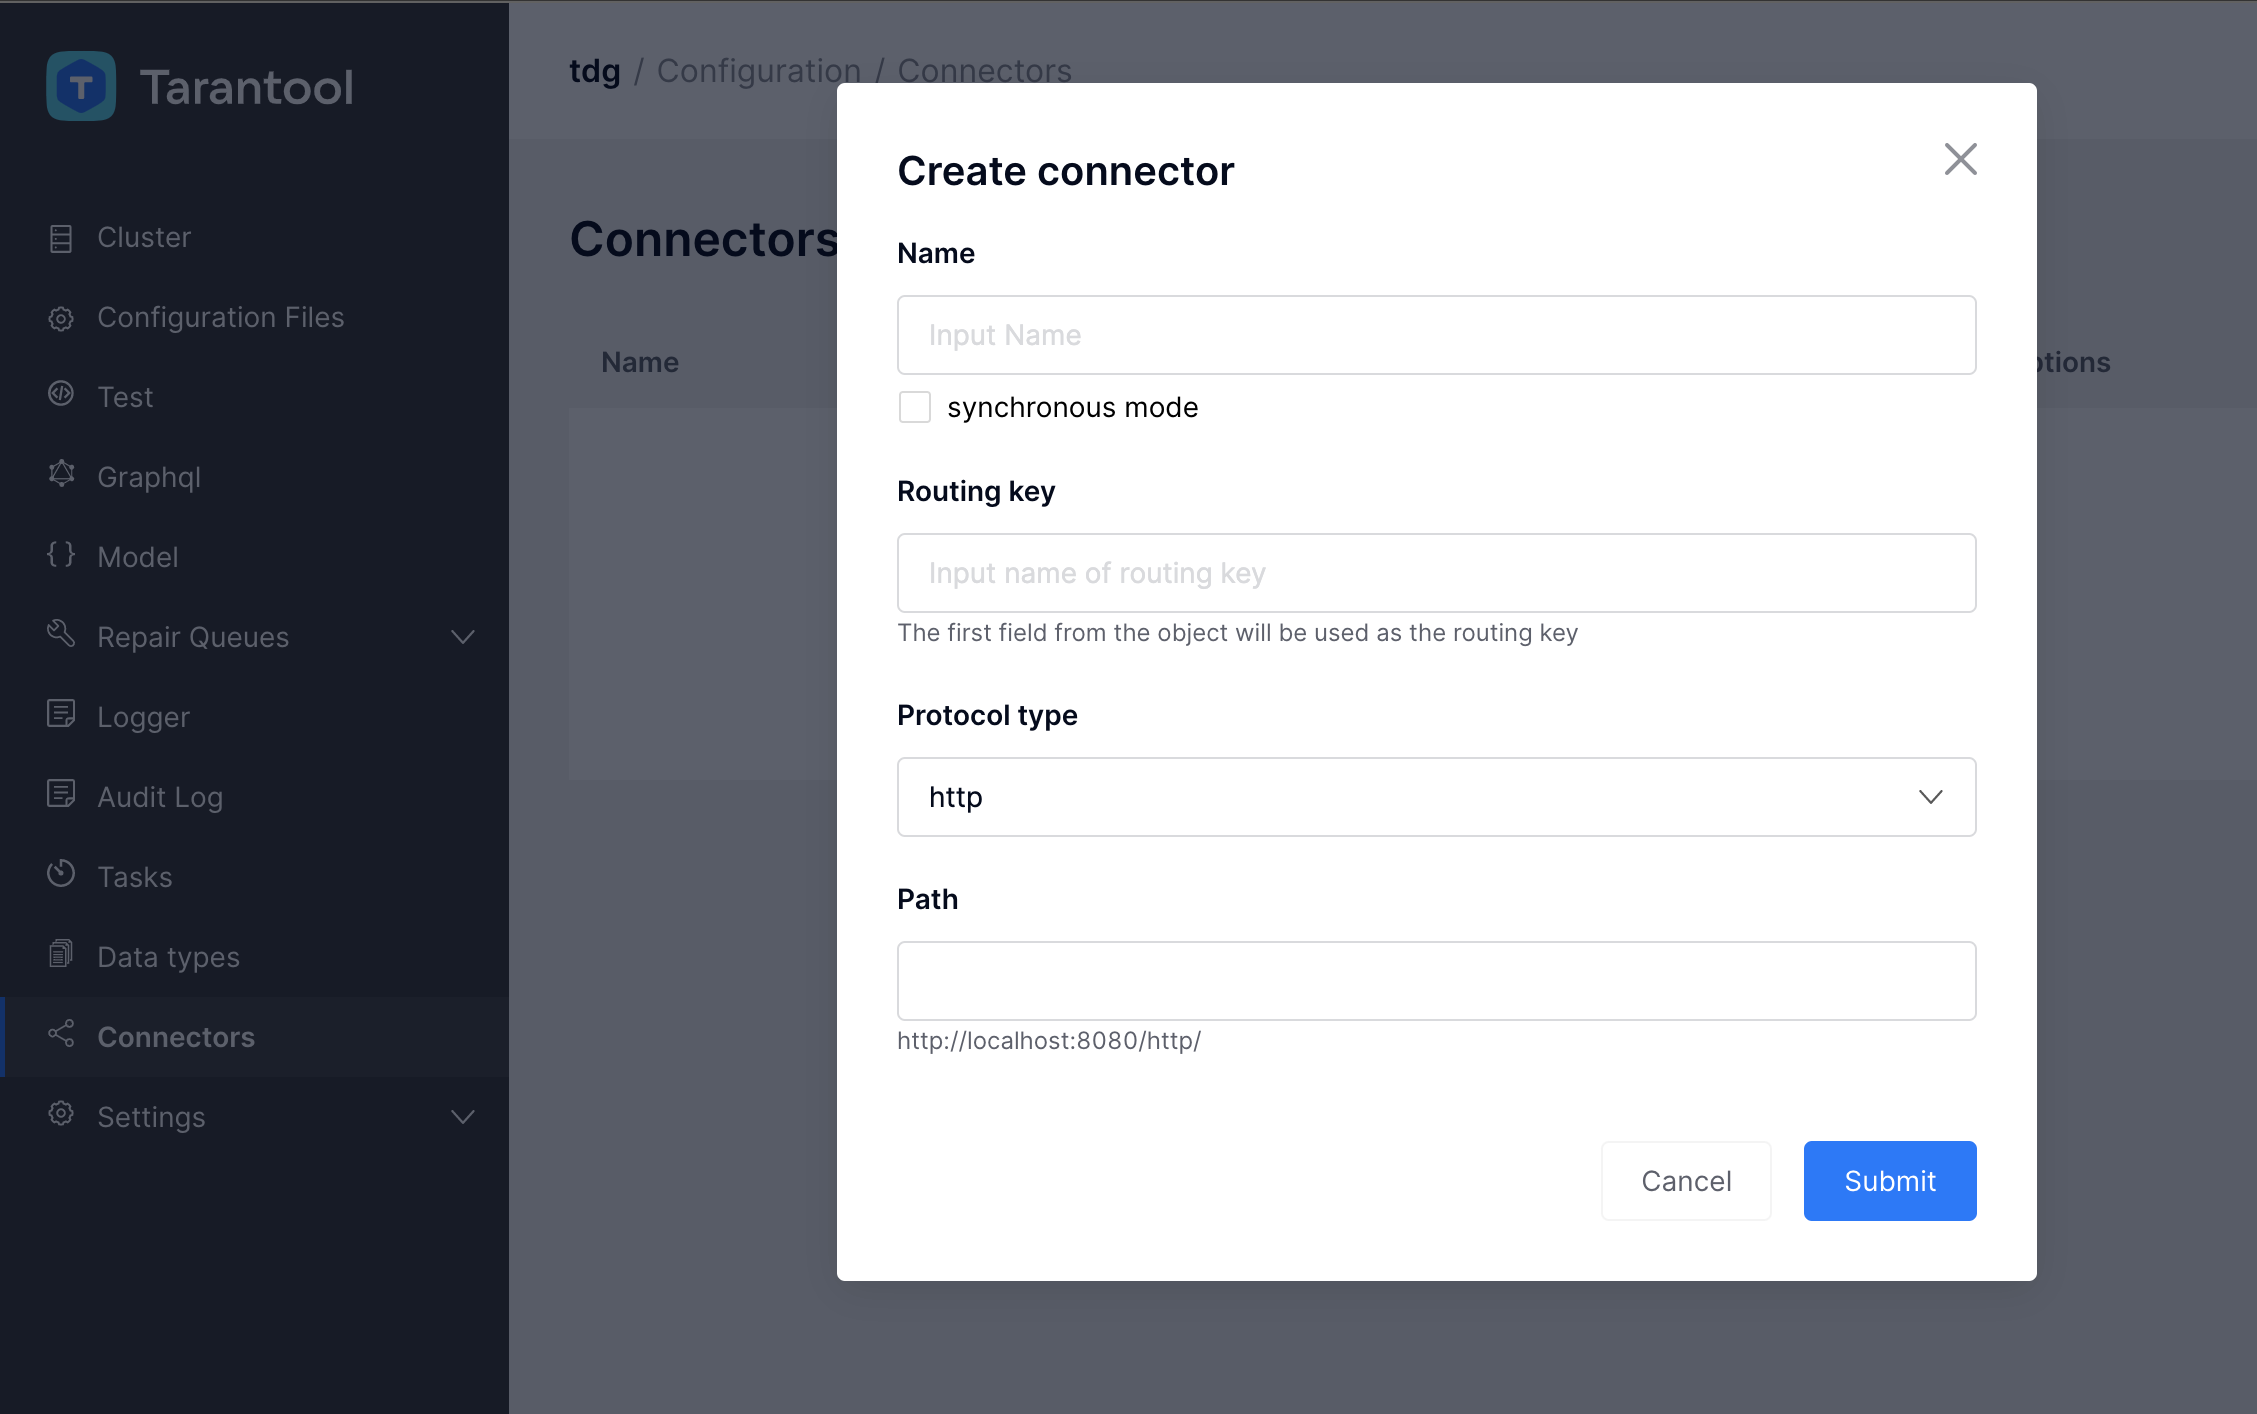
Во вкладке Connectors нажмите кнопку Add connector:
Появится окно Create connector, где нужно ввести параметры коннектора:
Параметры коннектора
При добавлении коннектора доступна настройка маршрутизации и input-параметров – параметров для получения и парсинга входящих запросов. Чтобы узнать больше об этих параметрах, обратитесь к разделу Параметры коннекторов. Ниже в таблице приведены поля, доступные для настройки в редакторе:
Название параметра |
Тип коннектора |
Описание |
Обязательный параметр |
|---|---|---|---|
Name |
Любой |
Имя коннектора, должно быть уникальным |
Да |
synchronous mode |
Любой |
Режим работы TDG в качестве producer. По умолчанию, режим асинхронный: подтверждение о доставке сообщения отправляется сразу после того, как сообщение добавлено в очередь на отправку. При синхронном режиме подтверждение о доставке отправляется только после того, как сообщение было доставлено. |
Да |
Routing key |
Любой |
Да |
|
Protocol type |
Любой |
Тип коннектора.
Доступные типы: |
Да |
Path |
|
Адрес для отправки запроса в TDG |
Да |
WSDL |
|
Схема WSDL, описывающая структуру входящего XML |
Да |
Success response template |
|
Шаблон ответа в случае успешной обработки запроса |
Нет |
Error response template |
|
Шаблон ответа в случае ошибки |
Нет |
Brokers |
|
URL-адреса брокеров сообщений |
Да |
Topics |
|
Топики в терминологии Kafka |
Да |
Group ID |
|
Идентификатор группы подписчиков |
Да |
Token name |
|
Нет |
|
Format |
|
Формат, в котором отправляется сообщение в Kafka.
Доступно с версии 2.18.0.
Возможные значения: |
Нет |
Options |
|
Опции библиотеки librdkafka |
Нет |
Print debug logs |
|
Режим отладки.
По умолчанию, отладка отключена.
При включении отладки по умолчанию используется параметр |
Нет |
Direct all non-error logs to TDG logger |
|
Запись всех логов Kafka, включая сообщения об ошибках, в логи TDG.
Соответствует параметру |
Нет |
Пример
Создадим новый коннектор типа http:

Для поля Path часть адреса определена заранее и не может быть изменена.
Предопределенный адрес – это URL, на котором запущен экземпляр TDG (например, http://localhost:8080/).
В поле можно указать только последнюю часть адреса – endpoint.
Значение по умолчанию для endpoint: http.
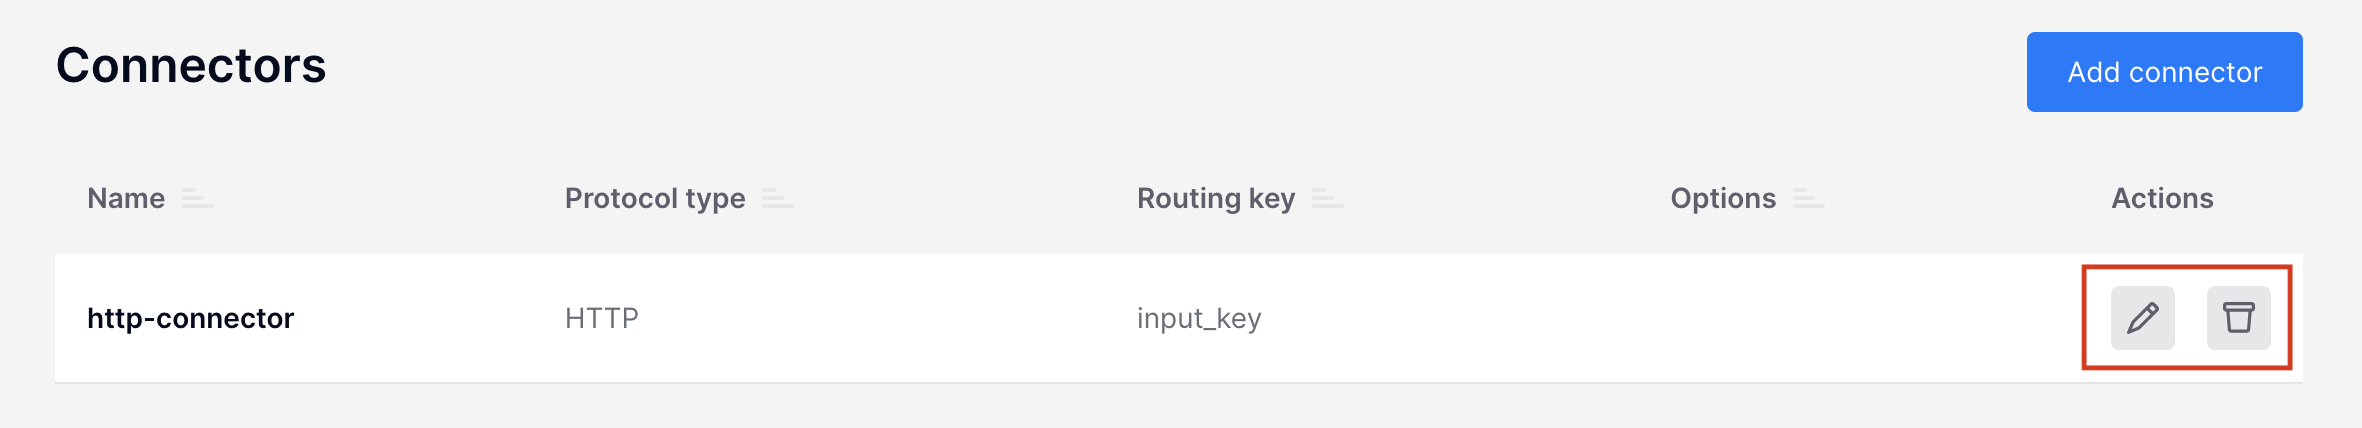
Когда все необходимые поля заполнены, нажмите кнопку Submit. Теперь список коннекторов выглядит следующим образом:
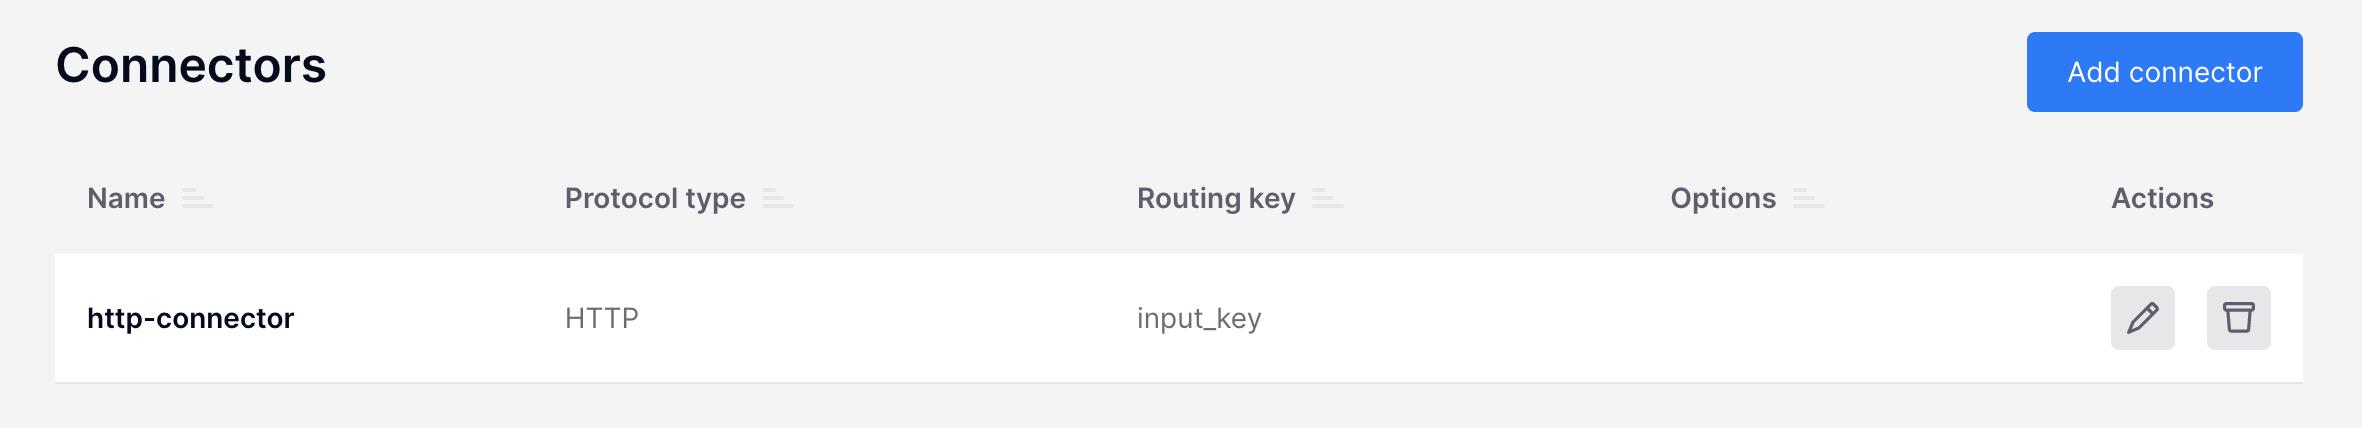
Столбцы Name, Protocol type, Routing key и Options в таблице можно сортировать по возрастанию и убыванию.
Управление коннекторами
Справа от каждого коннектора в списке находятся кнопки, позволяющие отредактировать его параметры или удалить коннектор:
Доступные функции:
Редактирование коннектора |
При изменении настроек существующего коннектора доступны все параметры, кроме типа коннектора. Данные о коннекторах в редакторе можно перезаписать и извне. Например, если загрузить во вкладку Configuration Files файл с новыми настройками коннектора, созданного ранее в редакторе, новая конфигурация отобразится во вкладке Connectors после обновления страницы. |
Удаление коннектора |
При попытке удалить коннектор появится диалоговое окно с подтверждением удаления. |